dotguidecn
使用dot绘制图形
本文是官网的dotguide.pdf的翻译,经过我逐字逐句地机器翻译并检查,排版为md文档。
鉴于后面一些附录不太必要而没有翻译,请自行看原版文档。
摘要
dot将有向图绘制为层次结构。它作为命令行程序、web可视化服务或兼容的图形界面运行。 它的功能包括用于放置节点和边缘样条、边缘标签、带有"端口"的"记录"形状,用于绘制 数据结构;集群布局;以及面向流的图形工具的底层文件语言。下面是SML-NJ编译器的 简化模块依赖关系图,在3GHz Intel Xeon上花费了0.23秒的用户时间。
dot draws directed graphs as hierarchies. It runs as a command line pro- gram, web visualization service, or with a compatible graphical interface. Its features include well-tuned layout algorithms for placing nodes and edge splines, edge labels, "record" shapes with "ports" for drawing data structures; cluster layouts; and an underlying file language for stream-oriented graph tools. Below is a reduced module dependency graph of an SML-NJ compiler that took 0.23 seconds of user time on a 3 GHz Intel Xeon.
一、基本图形绘制
dot绘制有向图。它读取属性图形文本文件并以图形文件或图形格式(如 GIF、PNG、SVG、PDF或PostScript)的形式写入图形。
dot分四个主要阶段绘制图形。了解这一点有助于您了解dot的布局类型以及如何控制它们。 dot使用的布局过程依赖于图是非循环的。因此,第一步是通过反转某些循环边的内部方向 来打破输入图中出现的任何循环。下一步将节点分配给离散的等级或级别。在从上到下的 绘图中,等级确定Y坐标。跨越一个等级的边被分成"虚拟"节点链和单位长度边。第三步 对等级内的节点进行排序以避免交叉。第四步设置节点的X坐标以保持边短,最后一步路由 边样条。这与大多数分层图形绘制程序的通用方法相同,基于Warfield [War77]、 Carpano [Car80]和Sugiyama [STT81]的工作。我们将读者推荐给[GKNV93] 以获得对dot算法的全面解释。
dot接受DOT语言的输入(参见附录D)。这种语言描述了三种主要的对象:图、节点和边。 主(最外层)图可以是有向图(有向图)或无向图。因为dot制作有向图的布局,所以以下 所有示例都使用digraph。(一个单独的布局实用程序,neato,绘制无向图[Nor92]) 在主图中,子图定义节点和边的子集。
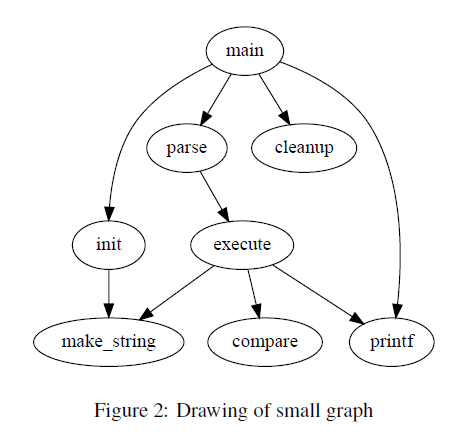
图1是DOT语言的示例图。第1行给出了图形名称和类型。后面的线创建节点、边或子图, 并设置属性。所有这些对象的名称可能是C标识符、数字或引用的C字符串。引号保护 标点和白色空间。
当节点的名称第一次出现在文件中时,就会创建一个节点。当边缘运算符->连接节点时 会创建一条边。在示例中,第2行创建了从main到parse以及从parse到execute的边。 在这个文件上运行dot(称为graph1.gv)
dot draws directed graphs. It reads attributed graph text files and writes drawings, either as graph files or in a graphics format such as GIF, PNG, SVG, PDF, or PostScript.
dot draws graphs in four main phases. Knowing this helps you to understand what kind of layouts dot makes and how you can control them. The layout procedure used by dot relies on the graph being acyclic. Thus, the first step is to break any cycles which occur in the input graph by reversing the internal direction of certain cyclic edges. The next step assigns nodes to discrete ranks or levels. In a top-to-bottom drawing, ranks determine Y coordinates. Edges that span more than one rank are broken into chains of "virtual" nodes and unit-length edges. The third step orders nodes within ranks to avoid crossings. The fourth step sets X coordinates of nodes to keep edges short, and the final step routes edge splines. This is the same general approach as most hierarchical graph drawing programs, based on the work of Warfield [War77], Carpano [Car80] and Sugiyama [STT81]. We refer the reader to [GKNV93] for a thorough explanation of dot’s algorithms.
dot accepts input in the DOT language (cf. Appendix D). This language describes three main kinds of objects: graphs, nodes, and edges. The main (outermost) graph can be directed (digraph) or undirected graph. Because dot makes layouts of directed graphs, all the following examples use digraph. (A separate layout utility, neato, draws undirected graphs [Nor92].) Within a main graph, a subgraph defines a subset of nodes and edges.
Figure 1 is an example graph in the DOT language. Line 1 gives the graph name and type. The lines that follow create nodes, edges, or subgraphs, and set attributes. Names of all these objects may be C identifiers, numbers, or quoted C strings. Quotes protect punctuation and white space.
A node is created when its name first appears in the file. An edge is created when nodes are joined by the edge operator ->. In the example, line 2 makes edges from main to parse, and from parse to execute. Running dot on this file (call it graph1.gv)
$ dot -Tps graph1.gv -o graph1.ps产生图2的绘图。命令行选项-Tps选择PostScript(EPSF)输出。graph1.ps可以由
PostScript查看器打印、显示或嵌入到另一个文档中。
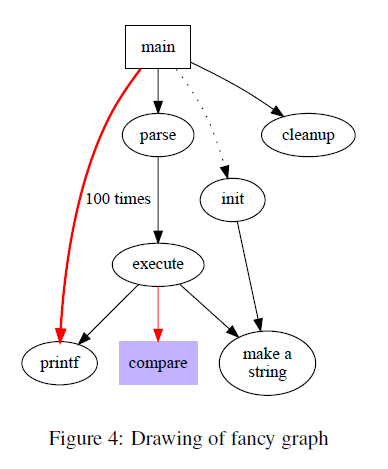
调整布局中节点和边缘的表示或位置通常很有用。这是通过在输入文件中设置节点、边 或子图的属性来完成的。属性是字符串的名称-值对。图3和图4说明了一些布局属性。 在图3的清单中,第2行将图形的大小设置为4,4(以英寸为单位)。该属性控制绘图的 大小;如果绘图太大,则根据需要统一缩放以适应.
节点或边缘属性在方括号中设置。在第3行,节点main被分配了shape box。第4行 中的边通过增加其权重来拉直(默认值为1)。第6行中的边缘绘制为虚线。第8行 使边缘从execute到make string和printf。在第10行,默认边缘颜色设置为red。 这会影响文件中此点之后创建的任何边。第11行用粗体标记了100次。在第12行, 节点make_string被赋予了一个多行标签。第13行将默认节点更改为一个填充有蓝色阴影 的框。节点比较继承这些值。
yields the drawing of Figure 2. The command line option -Tps selects PostScript (EPSF) output. graph1.ps may be printed, displayed by a PostScript viewer, or embedded in another document.
It is often useful to adjust the representation or placement of nodes and edges in the layout. This is done by setting attributes of nodes, edges, or subgraphs in the input file. Attributes are name-value pairs of character strings. Figures 3 and 4 illustrate some layout attributes. In the listing of Figure 3, line 2 sets the graph’s size to 4,4 (in inches). This attribute controls the size of the drawing; if the drawing is too large, it is scaled uniformly as necessary to fit.
Node or edge attributes are set off in square brackets. In line 3, the node main is assigned shape box. The edge in line 4 is straightened by increasing its weight (the default is 1). The edge in line 6 is drawn as a dotted line. Line 8 makes edges from execute to make string and printf. In line 10 the default edge color is set to red. This affects any edges created after this point in the file. Line 11 makes a bold edge labeled 100 times. In line 12, node make_string is given a multi-line label. Line 13 changes the default node to be a box filled with a shade of blue. The node compare inherits these values.
1: digraph G {
2: main -> parse -> execute;
3: main -> init;
4: main -> cleanup;
5: execute -> make_string;
6: execute -> printf
7: init -> make_string;
8: main -> printf;
9: execute -> compare;
10: }
Figure 1: Small graph
二、绘制属性
影响图形绘制的主要属性总结在附录A、B和C中。有关更多属性和更完整的属性描述, 您应该参考Graphviz网站,具体:
The main attributes that affect graph drawing are summarized in Appendices A, B and C. For more attributes and a more complete description of the attributes, you should refer to the Graphviz web site, specifically
www.graphviz.org/doc/info/attrs.html节点形状
默认情况下,使用shape=ellipse、width=.75、height=.5绘制节点并由节点名称标记。 其他常见的形状包括框、圆、记录和明文。附录H给出了主要节点形状的列表。节点形状 明文特别有趣,因为它绘制了一个没有任何轮廓的节点,这是某些图表中的重要约定。 在图形结构是主要关注点的情况下,尤其是当图形较大时,点形状会减少节点以显示最少 的内容。绘制时,节点的实际大小是请求的大小和其文本标签所需的区域中的较大者, 除非fixedsize=true,在这种情况下强制执行宽度和高度值。
节点形状分为两大类:基于多边形和基于记录,1。考虑除record和Mrecord之外的所有 节点形状多边形,和由边数建模(椭圆和圆形是特殊情况),和一个其他一些几何 属性。其中一些属性可以在一个图形。如果regular=true,则强制该节点为正则。 这范围外围设置绘制的边界曲线的数量。例如,双圆的peripheries=2。方向属性指定 多边形的顺时针旋转,以度为单位。
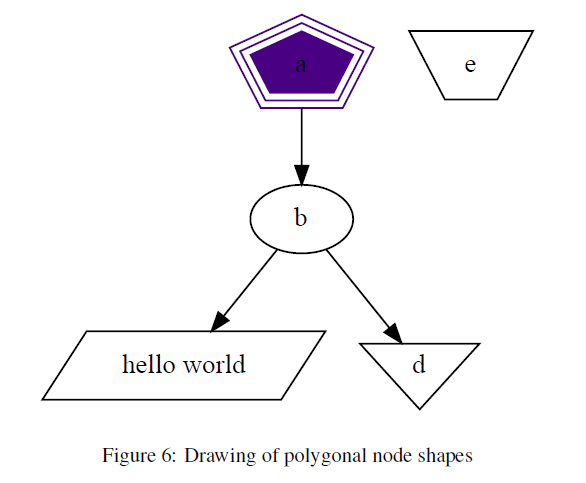
形状多边形公开了所有多边形参数,对于创建许多未预定义的形状很有用。除了上面提到 的参数regular、peripheries和orientation之外,多边形还通过边数、skew和distortion 进行参数化。skew是一个浮点数(通常在-1.0和1.0之间),通过从上到下倾斜来 扭曲形状,正值将多边形的顶部向右移动。因此,倾斜可用于将盒子变成平行四边形。 变形从上到下缩小多边形,负值导致底部大于顶部。扭曲将一个盒子变成一个梯形。 图6和图5显示了这些多边形的各种属性。
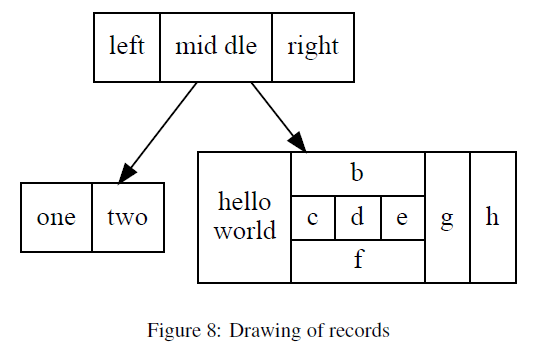
基于记录的节点形成另一类节点形状。其中包括形状记录和Mrecord。两者是相同的,只是 后者具有圆角。这些节点表示字段的递归列表,它们被绘制为交替的水平和垂直行的框。 递归结构确定经过这节点的标签,它具有以下结构:
Nodes are drawn, by default, with shape=ellipse, width=.75, height=.5 and labeled by the node name. Other common shapes include box, circle, record and plaintext. A list of the main node shapes is given in Appendix H. The node shape plaintext is of particularly interest in that it draws a node without any outline, an important convention in some kinds of diagrams. In cases where the graph structure is of main concern, and especially when the graph is moderately large, the point shape reduces nodes to display minimal content. When drawn, a node’s actual size is the greater of the requested size and the area needed for its text label, unless fixedsize=true, in which case the width and height values are enforced.
Node shapes fall into two broad categories: polygon-based and record-based,1. All node shapes except record and Mrecord are considered polygonal, and are modeled by the number of sides (ellipses and circles being special cases), and a few other geometric properties. Some of these properties can be specified in a graph. If regular=true, the node is forced to be regular. The parameter peripheries sets the number of boundary curves drawn. For example, a doublecircle has peripheries=2. The orientation attribute specifies a clockwise rotation of the polygon, measured in degrees.
The shape polygon exposes all the polygonal parameters, and is useful for creating many shapes that are not predefined. In addition to the parameters regular, peripheries and orientation, mentioned above, polygons are parameterized by number of sides sides, skew and distortion. skew is a floating point number (usually between 1.0 and 1.0) that distorts the shape by slanting it from top-to-bottom, with positive values moving the top of the polygon to the right. Thus, skew can be used to turn a box into a parallelogram. distortion shrinks the polygon from top-to-bottom, with negative values causing the bottom to be larger than the top. distortion turns a box into a trapezoid. A variety of these polygonal attributes are illustrated in Figures 6 and 5.
Record-based nodes form the other class of node shapes. These include the shapes record and Mrecord. The two are identical except that the latter has rounded corners. These nodes represent recursive lists of fields, which are drawn as alternating horizontal and vertical rows of boxes. The recursive structure is determined by the node’s label, which has the following schema:
rlabel → field ( ’|’ field )*
field → boxLabel | ’’ rlabel ’’
boxLabel → [ ’<’ string ’>’ ] [ string ]
1, 这里有一种实现自定义节点形状的方法,使用shape=epsf和shapefile属性,并依赖 PostScript输出。详细信息超出了本用户指南的范围,请联系作者了解更多信息。
1, There is a way to implement custom node shapes, using shape=epsf and the shapefile attribute, and relying on PostScript output. The details are beyond the scope of this user’s guide. Please contact the authors for further information.
1: digraph G {
2: size ="4,4";
3: main [shape=box]; /* this is a comment */
4: main -> parse [weight=8];
5: parse -> execute;
6: main -> init [style=dotted];
7: main -> cleanup;
8: execute -> { make_string; printf}
9: init -> make_string;
10: edge [color=red]; // so is this
11: main -> printf [style=bold,label="100 times"];
12: make_string [label="make a\nstring"];
13: node [shape=box,style=filled,color=".7 .3 1.0"];
14: execute -> compare;
15: }
Figure 3: Fancy graph
文字大括号、竖条和尖括号必须转义。空格被解释为标记之间的分隔符,因此如果要在文本 中按字面意思显示,则必须对其进行转义。boxLabel中的第一个字符串为字段提供了一个 名称,并用作该框的端口名(参见第3.1节)。第二个字符串用作字段的标签;它可能包含 与多行标签相同的转义序列(参见第2.2节)。图7和图8的示例说明了记录的使用和一些 属性。
Literal braces, vertical bars and angle brackets must be escaped. Spaces are interpreted as separators between tokens, so they must be escaped if they are to appear literally in the text. The first string in a boxLabel gives a name to the field, and serves as a port name for the box (cf. Section 3.1). The second string is used as a label for the field; it may contain the same escape sequences as multi-line labels (cf. Section 2.2). The example of Figures 7 and 8 illustrates the use and some properties of records.
标签
如上所述,默认节点标签是其名称。默认情况下,边未标记。可以使用label属性显式设置 节点和边标签,如图4所示。
虽然按名称标记节点可能很方便,但有时必须显式设置标签。例如,在绘制文件目录树 时,可能有几个名为src的目录,但每个目录必须具有唯一的节点标识符。
As mentioned above, the default node label is its name. Edges are unlabeled by default. Node and edge labels can be set explicitly using the label attribute as shown in Figure 4.
Though it may be convenient to label nodes by name, at other times labels must be set explicitly. For example, in drawing a file directory tree, one might have several directories named src, but each one must have a unique node identifier.
1: digraph G {
2: a -> b -> c;
3: b -> d;
4: a [shape=polygon,sides=5,peripheries=3,color=lightblue,style=filled];
5: c [shape=polygon,sides=4,skew=.4,label="hello world"]
6: d [shape=invtriangle];
7: e [shape=polygon,sides=4,distortion=.7];
8: }
Figure 5: Graph with polygonal shapes
1: digraph structs {
2: node [shape=record];
3: struct1 [shape=record,label="<f0> left|<f1> mid\ dle|<f2> right"];
4: struct2 [shape=record,label="<f0> one|<f1> two"];
5: struct3 [shape=record,label="hello\nworld |{ b |{c|<here> d|e}| f}| g | h"];
6: struct1 -> struct2;
7: struct1 -> struct3;
8: }
Figure 7: Records with nested fields
inode编号或完整路径名是合适的唯一标识符。然后可以将每个节点的标签设置为其目录中 的文件名。
多行标签可以通过使用转义序列\n、\l、\r来终止居中或左对齐或右对齐的行来创建2。
图和簇子图也可能有标签。默认情况下,图形标签显示在图形下方的中心位置。设置 labelloc=t使标签在图形上方居中。簇标签显示在左上角的封闭矩形内。值labelloc=b 将标签移动到矩形的底部。设置labeljust=r将标签向右移动。
默认字体为14磅Times Roman,黑色。可以使用属性fontname、fontsize和fontcolor选择 其他字体系列、大小和颜色。字体名称应与目标解释器兼容。最好只使用标准字体系列 Times、Helvetica、Courier或Symbol,因为它们保证可以与任何目标图形语言一起使用。 例如,Times Italic、Times Bold和Courier是可移植的;AvantegardeMioblique不是。
对于位图输出,如GIF或JPG,dot依赖于在布局期间提供这些字体。Graphviz的大多数 预编译安装都使用fontconfig库将字体名称与可用的FontFile进行匹配。fontconfig附带 了一组用于显示匹配项和安装字体的实用程序。请参阅fontconfig文档或外部Graphviz FontFAQ或了解更多详细信息。若Graphviz是在没有fontconfig的情况下构建的(这通常 意味着您自己从源代码编译了它),fontpath属性可以指定一个目录列表3,其中应搜索 字体文件。如果未设置,dot将使用DOTFONTPATH环境变量,如果未设置,则使用 GDFONTPATH环境变量。如果未设置这些选项,dot将使用内置列表。
边缘标签位于边缘中心附近。通常,应注意防止边缘标签与边缘和节点重叠。在复杂的 图形中,仍然很难确定标签属于哪条边。如果"装饰"属性设置为true,则会绘制一条将 标签与其边缘连接的线。有时,避免边标签和边之间的冲突会迫使图形比所需的大。如果 labelfloat=true,dot不会试图防止此类重叠,从而允许更紧凑的绘图。
The inode number or full path name are suitable unique identifiers. Then the label of each node can be set to the file name within its directory.
Multi-line labels can be created by using the escape sequences
\n,\l,\r to terminate lines that are centered, or left or
right justified.2 Graphs and cluster subgraphs may also have labels.
Graph labels appear, by default, centered below the graph. Setting
labelloc=t centers the label above the graph. Cluster labels appear
within the enclosing rectangle, in the upper left corner. The value
labelloc=b moves the label to the bottom of the rectangle. The setting
labeljust=r moves the label to the right.
The default font is 14-point Times-Roman, in black. Other font families, sizes and colors may be selected using the attributes fontname, fontsize and fontcolor. Font names should be compatible with the target interpreter. It is best to use only the standard font families Times, Helvetica, Courier or Symbol as these are guaranteed to work with any target graphics language. For example, Times-Italic, Times-Bold, and Courier are portable; AvanteGarde- DemiOblique isn’t.
For bitmap output, such as GIF or JPG, dot relies on having these fonts available during layout. Most precompiled installations of Graphviz use the fontconfig library for matching font names to available fontfiles. fontconfig comes with a set of utilities for showing matches and installing fonts. Please refer to the fontconfig documentation, or the external Graphviz FontFAQ or for further details. If Graphviz is built without fontconfig (which usually means you compiled it from source code on your own), the fontpath attribute can specify a list of directories3 which should be searched for the font files. If this is not set, dot will use the DOTFONTPATH environment variable or, if this is not set, the GDFONTPATH environment variable. If none of these is set, dot uses a builtin list.
Edge labels are positioned near the center of the edge. Usually, care is taken to prevent the edge label from overlapping edges and nodes. It can still be difficult, in a complex graph, to be certain which edge a label belongs to. If the decorate attribute is set to true, a line is drawn connecting the label to its edge. Sometimes avoiding collisions among edge labels and edges forces the drawing to be bigger than desired. If labelfloat=true, dot does not try to prevent such overlaps, allowing a more compact drawing.
边缘还可以使用headlabel和taillabel指定附加标签,这些标签放置在边缘的末端附近。 这些标签的特征是使用属性labelfontname、labelfontsize和labelfontcolor指定的。 这些标签放置在边缘和节点的交点附近,因此可能会干扰它们。要调整绘图,用户可以 设置labelangle和labeldistance属性。前者设置角度,以度为单位,标签从边缘与 节点入射的角度旋转。后者设置一个乘法比例因子来调整标签与节点的距离。
An edge can also specify additional labels, using headlabel and taillabel, which are be placed near the ends of the edge. The characteristics of these labels are specified using the attributes labelfontname, labelfontsize and labelfontcolor. These labels are placed near the intersection of the edge and the node and, as such, may interfere with them. To tune a drawing, the user can set the labelangle and labeldistance attributes. The former sets the angle, in degrees, which the label is rotated from the angle the edge makes incident with the node. The latter sets a multiplicative scaling factor to adjust the distance that the label is from the node.
2, 转义序列\N是节点名称的内部符号。
3,
对于基于Unix的系统,这是路径名的串联列表,由冒号分隔。对于基于Windows的系统,
路径名由分号分隔。
2, The escape sequence \N is an internal symbol for node
names.
3, For Unix-based systems, this is a concatenated list of pathnames,
separated by colons. For Windows-based systems, the pathnames are
separated by semicolons.
HTML类似标签
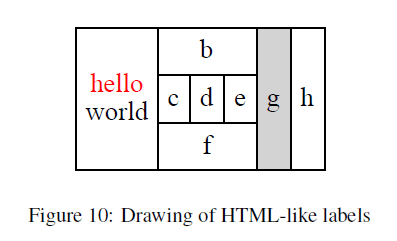
为了以更精细的粒度允许更丰富的属性集合,dot接受使用HTML语法的类似HTML的标签。 这些是使用由<...>分隔的字符串指定的而不是双引号。在这些分隔符中,字符串必须 遵循HTML的词法、引用和句法约定。
通过使用<TABLE>元素,这些标签可以被视为shape=record的扩展和替换。有了这些, 人们可以在盒子级别更改颜色和字体,并包含图像。<TD>元素的PORT属性提供了单元 的端口名称(参见第3.1节)。
尽管类似HTML的标签只是一种特殊类型的标签属性,但人们经常使用它们,就好像它们是 一种类似于记录的新型节点形状。因此,当使用这些时,经常会看到shape=none和 margin=0。另请注意,作为标签,这些可以与边和图以及节点一起使用。
图9和图10给出了使用类似HTML的标签的示例。
In order to allow a richer collection of attributes at a finer granularity, dot accepts HTML-like labels using HTML syntax. These are specified using strings that are delimited by <...> rather than double-quotes. Within these delimiters, the string must follow the lexical, quoting, and syntactic conventions of HTML.
By using the <TABLE> element, these labels can be viewed as an extension of and replacement for shape=record. With these, one can alter colors and fonts at the box level, and include images. The PORT attribute of a <TD> element provides a port name for the cell (cf. Section 3.1).
Although HTML-like labels are just a special type of label attribute, one frequently uses them as though they were a new type of node shape similar to records. Thus, when these are used, one often sees shape=none and margin=0. Also note that, as a label, these can be used with edges and graphs as well as nodes.
Figures 9 and 10 give an example of the use of HTML-like labels.
图形样式
节点和边可以指定颜色属性,默认为黑色。这是用于绘制节点形状或边缘的颜色。颜色值 可以是色调-饱和度-亮度三元组(0到1之间的三个浮点数,以逗号分隔);附录J中 列出的颜色名称之一(借自X窗口系统的某些版本);或红绿蓝(RGB)三元组,4(00到FF之间 的三个十六进制数,前面带有字符'#')。因此,值"orchid"、"0.8396,0.4862,0.8549"和 "#DA70D6"是指定相同颜色的三种方式。数字形式对于自动生成颜色的脚本或工具来说很 方便。颜色名称查找不区分大小写并忽略非字母数字字符,因此warmgrey和Warm_Grey是 等价的。
我们可以提供一些关于在图表中使用颜色的提示。首先,避免使用过多的亮色。 "彩虹效应"令人困惑。最好选择更窄的颜色范围,或者随着色调的变化饱和度。其次,当 节点用深色或非常饱和的颜色填充时,使用fontcolor=white和fontname=Helvetica的 标签似乎更具可读性。(我们还有用于dot的PostScript函数,可以从普通字体创建轮廓 字体。)第三,在某些输出格式中,您可以定义自己的颜色空间。例如,如果使用 PostScript进行输出,您可以在库文件中重新定义nodecolor、edgecolor或 graphcolor。因此,要使用RGB颜色,请将以下行放在文件lib.ps中。
Nodes and edges can specify a color attribute, with black the default. This is the color used to draw the node’s shape or the edge. A color value can be a huesaturation-brightness triple (three floating point numbers between 0 and 1, separated by commas); one of the colors names listed in Appendix J (borrowed from some version of the X window system); or a red-green-blue (RGB) triple4 (three hexadecimal number between 00 and FF, preceded by the character ’#’). Thus, the values "orchid", "0.8396,0.4862,0.8549" and "#DA70D6" are three ways to specify the same color. The numerical forms are convenient for scripts or tools that automatically generate colors. Color name lookup is case-insensitive and ignores non-alphanumeric characters, so warmgrey and Warm_Grey are equivalent.
We can offer a few hints regarding use of color in graph drawings. First, avoid using too many bright colors. A "rainbow effect" is confusing. It is better to choose a narrower range of colors, or to vary saturation along with hue. Second, when nodes are filled with dark or very saturated colors, labels seem to be more readable with fontcolor=white and fontname=Helvetica. (We also have PostScript functions for dot that create outline fonts from plain fonts.) Third, in certain output formats, you can define your own color space. For example, if using PostScript for output, you can redefine nodecolor, edgecolor, or graphcolor in a library file. Thus, to use RGB colors, place the following line in a file lib.ps.
/nodecolor {setrgbcolor} bind def使用-l命令行选项加载此文件。 Use the -l command line option to load this file.
dot -Tps -l lib.ps file.gv -o file.ps4, 还支持第四种格式RGBA,其格式与RGB相同,另外还有一个十六进制数字,用于指定 alpha通道或透明度信息。
4, A fourth form, RGBA, is also supported, which has the same format as RGB with an additional fourth hexadecimal number specifying alpha channel or transparency information.
1: digraph html {
2: abc [shape=none, margin=0, label=<
3: <TABLE BORDER="0" CELLBORDER="1" CELLSPACING="0" CELLPADDING="4">
4: <TR><TD ROWSPAN="3"><FONT COLOR="red">hello</FONT><BR/>world</TD>
5: <TD COLSPAN="3">b</TD>
6: <TD ROWSPAN="3" BGCOLOR="lightgrey">g</TD>
7: <TD ROWSPAN="3">h</TD>
8: </TR>
9: <TR><TD>c</TD>
10: <TD PORT="here">d</TD>
11: <TD>e</TD>
12: </TR>
13: <TR><TD COLSPAN="3">f</TD>
14: </TR>
15: </TABLE>>];
16: }
Figure 9: HTML-like labels
style属性控制节点和边的各种图形特征。这个属性是一个逗号分隔的原语列表,带有可选 的参数列表。预定义的原语包括solid、dashed、dotted、bold和invis。前四个 控制线在节点边界和边的绘制中具有明显的意义。值invis导致节点或边不被绘制。节点的 样式还可以包括填充、对角线和圆角。使用颜色fillcolor填充节点内的阴影。如果未 设置,则使用颜色值。如果这也未设置,则使用浅灰色5作为默认值。对角线样式导致在 顶点附近的成对边之间绘制短对角线。圆形的样式使圆形多边形角。
用户定义的样式原语可以作为自定义PostScript过程实现。在绘制图形、节点或边的任何
标记之前,将在其gsave上下文中执行这些原语。参数列表被转换为PostScript符号。
例如,使用粗轮廓绘制style="setlinewidth(8)"的节点。在这里,setlinewidth是内置
的PostScript,但用户定义的PostScript过程的调用方式相同。这些过程的定义可以在
使用-l加载的库文件中给出,如上所示。
The style attribute controls miscellaneous graphics features of nodes and edges. This attribute is a comma-separated list of primitives with optional argument lists. The predefined primitives include solid, dashed, dotted, bold and invis. The first four control line drawing in node boundaries and edges and have the obvious meaning. The value invis causes the node or edge to be left undrawn. The style for nodes can also include filled, diagonals and rounded. filled shades inside the node using the color fillcolor. If this is not set, the value of color is used. If this also is unset, light grey5 is used as the default. The diagonals style causes short diagonal lines to be drawn between pairs of sides near a vertex. The rounded style rounds polygonal corners.
User-defined style primitives can be implemented as custom PostScript procedures. Such primitives are executed inside the gsave context of a graph, node, or edge, before any of its marks are drawn. The argument lists are translated to PostScript notation. For example, a node with style="setlinewidth(8)" is drawn with a thick outline. Here, setlinewidth is a PostScript builtin, but user-defined PostScript procedures are called the same way. The definition of these procedures can be given in a library file loaded using -l as shown above.
边有一个dir属性来设置箭头。dir可以是forward(默认)、back、both或none。 这仅指绘制箭头的位置,不会更改底层图形。例如,设置dir=back会导致在尾部绘制一个 箭头,而在头部没有箭头,但它不会交换边缘的端点。属性arrowhead和arrowtail 指定箭头的样式(如果有),用于边缘的头尾端。允许的值为normal、inv、dot、invdot、 odot、invodot和none(参见附录I)。属性arrowsize指定了一个乘法因子,它影响绘制 在边缘上的任何箭头的大小。例如,arrowsize=2.0使箭头长一倍,宽一倍。
在样式和颜色方面,集群的行为有点像大盒子状节点,因为集群边界是使用集群的颜色属性 绘制的,通常集群的外观会受到样式、颜色和填充颜色属性的影响。
如果根图指定了bgcolor属性,则此颜色用作整个绘图的背景,同时也用作默认填充颜色。
Edges have a dir attribute to set arrowheads. dir may be forward (the default), back, both, or none. This refers only to where arrowheads are drawn, and does not change the underlying graph. For example, setting dir=back causes an arrowhead to be drawn at the tail and no arrowhead at the head, but it does not exchange the endpoints of the edge. The attributes arrowhead and arrowtail specify the style of arrowhead, if any, which is used at the head and tail ends of the edge. Allowed values are normal, inv, dot, invdot, odot, invodot and none (cf. Appendix I). The attribute arrowsize specifies a multiplicative factor affecting the size of any arrowhead drawn on the edge. For example, arrowsize=2.0 makes the arrow twice as long and twice as wide.
In terms of style and color, clusters act somewhat like large box-shaped nodes, in that the cluster boundary is drawn using the cluster’s color attribute and, in general, the appearance of the cluster is affected the style, color and fillcolor attributes.
If the root graph has a bgcolor attribute specified, this color is used as the background for the entire drawing, and also serves as the default fill color.
5, 如果输出格式为MIF或形状为点,则默认为黑色。5, The default is black if the output format is MIF, or if the shape is point.
绘图方向、尺寸和间距
在确定点图形大小方面起重要作用的两个属性是nodesep和ranksep。第一个指定相同列组 上两个相邻节点之间的最小距离(以英寸为单位)。第二种是处理等阶分离,即一个等阶 中的节点底部与下一等阶中的节点顶部之间的最小垂直空间。ranksep属性以英寸为单位 设置等阶间隔。或者,可以让ranksep=equally。这保证了从相邻列上的节点中心测量时, 所有列的间距相等。在这种情况下,两个列之间的间距至少是默认的列间距。由于ranksep 的两个用途是独立的,因此可以同时设置这两个用途。例如,ranksep="1.0 equally"使 列组等距分布,最小列组间距为1英寸。
通常,使用默认节点大小和间距绘制的图形对于目标打印机或文档中图形所允许的空间 来说太大。有几种方法可以解决这个问题。首先,我们将回顾dot如何计算最终布局大小。
布局最初使用默认设置以其"natural"大小在内部创建(除非设置了ratio=compress,如下
所述)。图形的大小或纵横比没有界限,因此如果图形较大,则布局也较大。如果未指定
大小或比率,则会打印自然尺寸布局。控制图形输出大小的最简单方法是在图形文件中
(或在命令行上使用-G)设置size="x,y"。这决定了最终布局的大小。例如,无论初始
布局有多大,size="7.5,10"都适用于8.5x11页面(假定默认页面方向)。
ratio也影响布局大小。根据大小和比率的设置,有许多情况。
Two attributes that play an important role in determining the size of a dot drawing are nodesep and ranksep. The first specifies the minimum distance, in inches, between two adjacent nodes on the same rank. The second deals with rank separation, which is the minimum vertical space between the bottoms of nodes in one rank and the tops of nodes in the next. The ranksep attribute sets the rank separation, in inches. Alternatively, one can have ranksep=equally. This guarantees that all of the ranks are equally spaced, as measured from the centers of nodes on adjacent ranks. In this case, the rank separation between two ranks is at least the default rank separation. As the two uses of ranksep are independent, both can be set at the same time. For example, ranksep="1.0 equally" causes ranks to be equally spaced, with a minimum rank separation of 1 inch.
Often a drawing made with the default node sizes and separations is too big for the target printer or for the space allowed for a figure in a document. There are several ways to try to deal with this problem. First, we will review how dot computes the final layout size.
A layout is initially made internally at its "natural" size, using default settings (unless ratio=compress was set, as described below). There is no bound on the size or aspect ratio of the drawing, so if the graph is large, the layout is also large. If you don’t specify size or ratio, then the natural size layout is printed. The easiest way to control the output size of the drawing is to set size="x,y" in the graph file (or on the command line using -G). This determines the size of the final layout. For example, size="7.5,10" fits on an 8.5x11 page (assuming the default page orientation) no matter how big the initial layout.
ratio also affects layout size. There are a number of cases, depending on the settings of size and ratio.
案例1。未设置比率。如果图形已经符合给定的大小,则什么也不会发生。否则,图形将 均匀缩小,以使关键尺寸匹配。如果设置了比率,则有四个子案例。
案例2a。如果ratio=x,其中x是一个浮点数,则将绘图按一维放大以达到以绘图高度/宽度 表示的请求比率。例如,ratio=2.0使绘图的宽度是宽度的两倍。然后使用案例1中的大小 缩放布局。
案例2b。如果设置了ratio=fill和size=x, y,则将绘图按一维放大以达到y/x比率。 然后像案例1一样进行缩放。效果是所有由size给出的边界框都被填充了。
案例2c。如果设置了ratio=compress和size=x,y,则压缩初始布局以尝试将其放入 给定的边界框中。这会权衡布局质量、平衡和对称性,以便更紧密地打包布局。然后按 情况1进行缩放。
情况2d。如果ratio=auto并且设置了page属性并且无法在单个页面上绘制图形,则 忽略size并且dot计算"理想"大小。特别是,给定维度中的大小将是该维度中页面 大小的最小整数倍,该维度至少是当前大小的一半。然后将这两个维度独立地缩放到新 的大小。
Case 1. ratio was not set. If the drawing already fits within the given size, then nothing happens. Otherwise, the drawing is reduced uniformly enough to make the critical dimension fit. If ratio was set, there are four subcases.
Case 2a. If ratio=x where x is a floating point number, then the drawing is scaled up in one dimension to achieve the requested ratio expressed as drawing height/width. For example, ratio=2.0 makes the drawing twice as high as it is wide. Then the layout is scaled using size as in Case 1.
Case 2b. If ratio=fill and size=x, y was set, then the drawing is scaled up in one dimension to achieve the ratio y/x. Then scaling is performed as in Case 1. The effect is that all of the bounding box given by size is filled.
Case 2c. If ratio=compress and size=x, y was set, then the initial layout is compressed to attempt to fit it in the given bounding box. This trades off layout quality, balance and symmetry in order to pack the layout more tightly. Then scaling is performed as in Case 1.
Case 2d. If ratio=auto and the page attribute is set and the graph cannot be drawn on a single page, then size is ignored and dot computes an "ideal" size. In particular, the size in a given dimension will be the smallest integral multiple of the page size in that dimension which is at least half the current size. The two dimensions are then scaled independently to the new size.
如果设置了rotate=90或orientation=landscape,则图形将旋转90度进入横向模式。布局 的X轴将沿着每个页面的Y轴。这不会影响dot对大小、比率或页面的解释。
此时,如果未设置页面,则最终布局将生成为一个页面如果设置了page=x,y,则布局将打印 为一系列页面,这些页面可以平铺或组装成马赛克。常用设置为page="8.5,11"或 page="11,17"。这些值表示物理设备的完整大小;实际使用的面积将通过边距设置减少。 (对于打印机输出,默认值为0.5英寸;对于位图输出,X和Y边距分别为10和2点。) 对于平铺布局,设置较小的边距可能会有所帮助。这可以通过使用margin属性来完成。 可以使用一个数字来设置两个边距,也可以使用两个用逗号分隔的数字来分别设置x和 y边距。和往常一样,单位是英寸。尽管可以将边距设置为0,但遗憾的是,许多位图打印机 具有无法覆盖的内部硬件边距。
If rotate=90 is set, or orientation=landscape, then the drawing is rotated 90◦ into landscape mode. The X axis of the layout would be along the Y axis of each page. This does not affect dot’s interpretation of size, ratio or page.
At this point, if page is not set, then the final layout is produced as one page. If page=x, y is set, then the layout is printed as a sequence of pages which can be tiled or assembled into a mosaic. Common settings are page="8.5,11" or page="11,17". These values refer to the full size of the physical device; the actual area used will be reduced by the margin settings. (For printer output, the default is 0.5 inches; for bitmap-output, the X and Y margins are 10 and 2 points, respectively.) For tiled layouts, it may be helpful to set smaller margins. This can be done by using the margin attribute. This can take a single number, used to set both margins, or two numbers separated by a comma to set the x and y margins separately. As usual, units are in inches. Although one can set margin=0, unfortunately, many bitmap printers have an internal hardware margin that cannot be overridden.
打印页面的顺序可以由pagedir属性控制。输出始终使用基于行或基于列的排序完成, 并且pagedir设置为指定主要和次要方向的两个字母代码。例如,默认值为BL,指定从下 到上(B)的主要顺序和从左到右(L)的次要顺序。因此,最下面一行的页面首先被发出, 从左到右,然后是第二行向上,从左到右,最后是最上面一行,从左到右。从上到下的顺序 用T表示,从右到左的顺序用R表示。如果center=true并且图形可以在一页上输出, 如果页面不是,则使用默认的8.5 x 11英寸的页面大小设置后,图形将重新定位到该页面 的中心。一个常见的问题是,以小尺寸绘制的大图会产生不可读的节点标签。为了制作更大 的标签,必须付出一些代价。一页上可以容纳的可读文本的数量是有限制的。通常,您可以 通过在运行dot之前提取原始图形的有趣部分来绘制较小的图形。我们有一些工具可以帮助 解决这个问题。
The order in which pages are printed can be controlled by the pagedir attribute. Output is always done using a row-based or column-based ordering, and pagedir is set to a two-letter code specifying the major and minor directions. For example, the default is BL, specifying a bottom-to-top (B) major order and a left-to-right (L) minor order. Thus, the bottom row of pages is emitted first, from left to right, then the second row up, from left to right, and finishing with the top row, from left to right. The top-to-bottom order is represented by T and the right-to-left order by R.
If center=true and the graph can be output on one page, using the default page size of 8.5 by 11 inches if page is not set, the graph is repositioned to be centered on that page.
A common problem is that a large graph drawn at a small size yields unreadable node labels. To make larger labels, something has to give. There is a limit to the amount of readable text that can fit on one page. Often you can draw a smaller graph by extracting an interesting piece of the original graph before running dot. We have some tools that help with this.
- sccmap:将图分解为强连通分量。
- tred:计算传递减少(删除传递隐含的边)。
- gvpr:图形处理器,用于选择节点或边,并收缩或删除图形的其余部分。
- unflatten:通过错开叶子边缘的长度来提高树的纵横比。
考虑到这一点,以下是在给定图表上尝试的一些事情:
- 增加节点fontsize。
- 使用更小的rankep和nodesep。
- 使用ratio=auto。
- 使用ratio=compress并给出合理的大小。
- 无衬线字体(例如Helvetica)在缩小时可能比Times更具可读性。
- sccmap: decompose the graph into strongly connected components.
- tred: compute transitive reduction (remove edges implied by transitivity).
- gvpr: graph processor to select nodes or edges, and contract or remove the rest of the graph.
- unflatten: improve aspect ratio of trees by staggering the lengths of leaf edges.
With this in mind, here are some thing to try on a given graph:
- Increase the node fontsize.
- Use smaller ranksep and nodesep.
- Use ratio=auto.
- Use ratio=compress and give a reasonable size.
- A sans serif font (such as Helvetica) may be more readable than Times when reduced.
节点和边放置
dot中的属性提供了多种方法来调整节点和边的大规模布局,以及微调图形以满足用户的 需求和口味。本节讨论这些属性,6.
有时,使边从左到右而不是从上到下指向是很自然的。如果顶级图形中的rankdir=LR,则 图形将以这种方式旋转。TB(从上到下)是默认值。rankdir=BT模式可用于绘制向上的 图形。为了完整性,还可以使用rankdir=RL。
Attributes in dot provide many ways to adjust the large-scale layout of nodes and edges, as well as fine-tune the drawing to meet the user’s needs and tastes. This section discusses these attributes6.
Sometimes it is natural to make edges point from left to right instead of from top to bottom. If rankdir=LR in the top-level graph, the drawing is rotated in this way. TB (top to bottom) is the default. The mode rankdir=BT is useful for drawing upward-directed graphs. For completeness, one can also have rankdir=RL.
6, 为完整起见,我们注意到dot还提供了对各种参数的访问,这些参数在布局算法中起着 技术作用。其中包括mclimit、nslimit、nslimit1、remincross和searchsize.
6, For completeness, we note that dot also provides access to various parameters which play technical roles in the layout algorithms. These include mclimit, nslimit, nslimit1, remincross and searchsize.
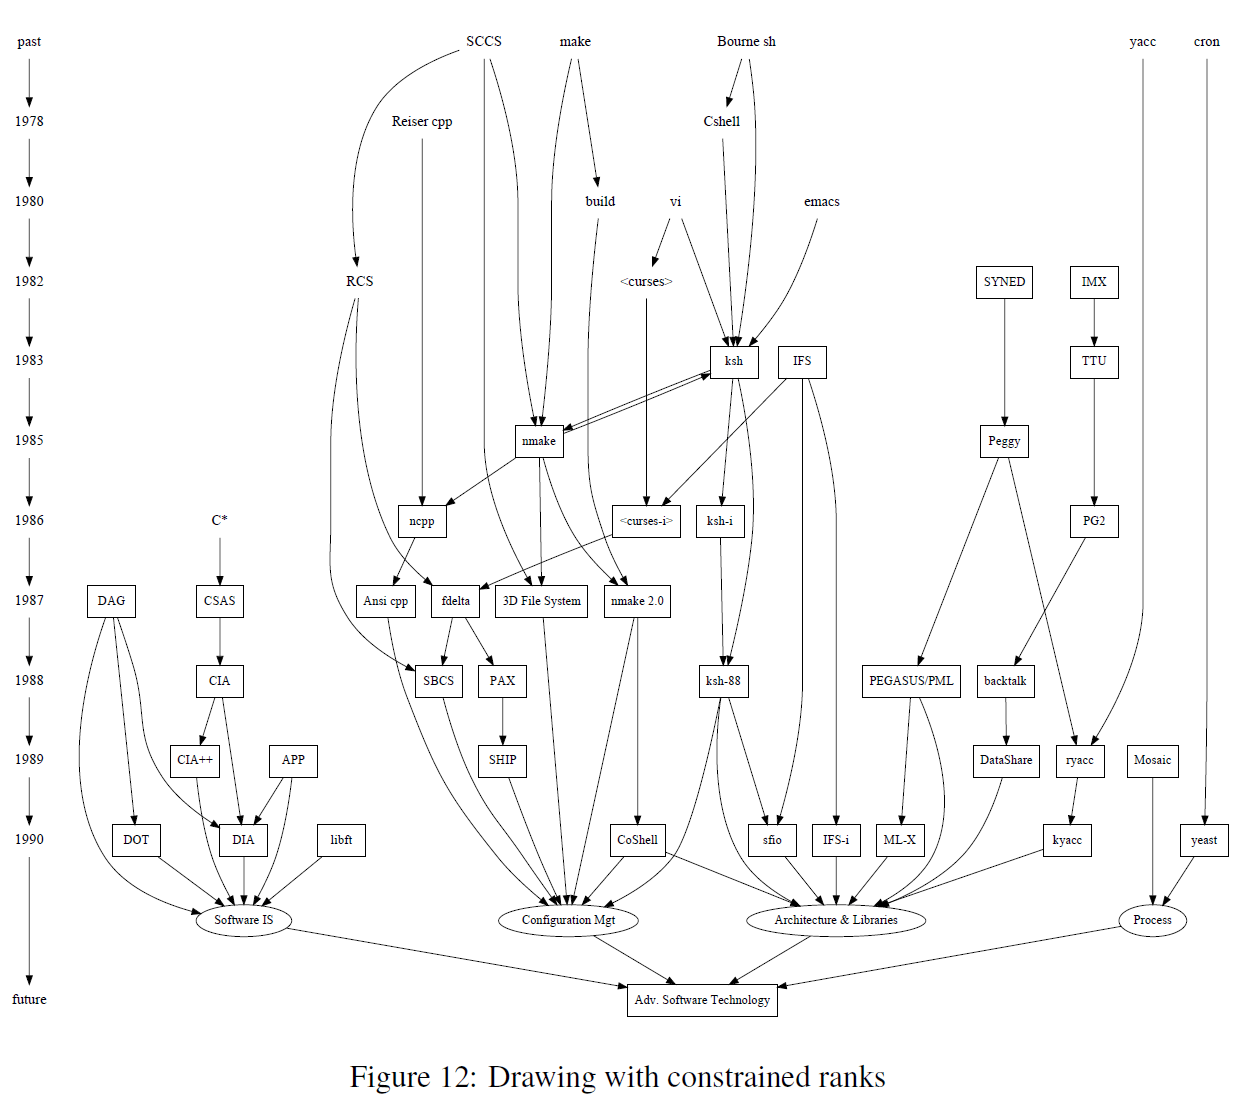
在具有时间线的图形中,或在强调源节点和汇节点的图形中,可能需要约束等阶分配。子图 的等阶可以设置为same、min、source、max或sink。值相同会导致子图中的所有节点出现 在相同的等阶上。如果设置为min,则子图中的所有节点都保证在一个等阶上至少与布局中 的任何其他节点一样小,7。这可以通过设置rank=source来严格实现,这会强制子图中的 节点的等阶严格小于任何其他节点的等阶(除了那些也由min或source子图指定的节点)。 值max或sink对最大等阶起着类似的作用。注意,这些约束会导致节点的等价类。如果一个 子图强制节点A和B位于同一秩上,而另一个子图强制节点C和B共享秩,则两个子图中的所有 节点都必须绘制在同一秩上。图11和图12说明了使用子图控制等阶分配。
在某些图中,节点的从左到右排序很重要。如果子图的ordering=out,则子图中具有相同 尾部节点的出边将按其创建顺序从左到右扇出。(还请注意,涉及头部节点的平边可能会 干扰其排序。)。
有许多方法可以微调节点和边的布局。例如,如果一条边的节点都具有相同的组属性,则 dot会尝试保持该边笔直,并避免其他边与之交叉。边的权重提供了另一种保持边笔直的 方法。边的权重表示边的重要性的某种度量;因此,权重越重,其节点之间的距离就越近。 dot使重量较重的边绘制得更短更直。
当节点被约束到相同的等阶时,边权重也起作用。这些节点之间权重不为零的边尽可能沿同 一方向(从左到右,或在旋转图形中从上到下)瞄准整个列组。可以利用这一事实,通过在 需要的地方放置不可见边(style="invi")来调整节点顺序。
与同一节点相邻的边的端点可以使用samehead和sametail属性约束。具体而言,具有相同 头部和相同头部值的所有边都将被约束为在同一点与头部节点相交。类似的属性适用于尾部 节点和sametail。
在等阶分配过程中,边的头节点被约束在比尾节点更高的等阶上。但是,如果边的 constraint=false,则不强制执行此要求。
在某些情况下,用户可能希望边的端点永远不要太近。这可以通过设置边的minlen属性 来获得。
In graphs with time-lines, or in drawings that emphasize source and sink nodes, you may need to constrain rank assignments. The rank of a subgraph may be set to same, min, source, max or sink. A value same causes all the nodes in the subgraph to occur on the same rank. If set to min, all the nodes in the subgraph are guaranteed to be on a rank at least as small as any other node in the layout,7. This can be made strict by setting rank=source, which forces the nodes in the subgraph to be on some rank strictly smaller than the rank of any other nodes (except those also specified by min or source subgraphs). The values max or sink play an analogous role for the maximum rank. Note that these constraints induce equivalence classes of nodes. If one subgraph forces nodes A and B to be on the same rank, and another subgraph forces nodes C and B to share a rank, then all nodes in both subgraphs must be drawn on the same rank. Figures 11 and 12 illustrate using subgraphs for controlling rank assignment.
In some graphs, the left-to-right ordering of nodes is important. If a subgraph has ordering=out, then out-edges within the subgraph that have the same tail node wll fan-out from left to right in their order of creation. (Also note that flat edges involving the head nodes can potentially interfere with their ordering.)
There are many ways to fine-tune the layout of nodes and edges. For example, if the nodes of an edge both have the same group attribute, dot tries to keep the edge straight and avoid having other edges cross it. The weight of an edge provides another way to keep edges straight. An edge’s weight suggests some measure of an edge’s importance; thus, the heavier the weight, the closer together its nodes should be. dot causes edges with heavier weights to be drawn shorter and straighter.
Edge weights also play a role when nodes are constrained to the same rank. Edges with non-zero weight between these nodes are aimed across the rank in the same direction (left-to-right, or top-to-bottom in a rotated drawing) as far as possible. This fact may be exploited to adjust node ordering by placing invisible edges (style="invis") where needed.
The end points of edges adjacent to the same node can be constrained using the samehead and sametail attributes. Specifically, all edges with the same head and the same value of samehead are constrained to intersect the head node at the same point. The analogous property holds for tail nodes and sametail.
During rank assignment, the head node of an edge is constrained to be on a higher rank than the tail node. If the edge has constraint=false, however, this requirement is not enforced.
In certain circumstances, the user may desire that the end points of an edge never get too close. This can be obtained by setting the edge’s minlen attribute.
7, 请记住,最小秩出现在图形的顶部。7, Recall that the minimum rank occurs at the top of a drawing.
digraph asde91 {
ranksep=.75; size = "7.5,7.5";
{
 node [shape=plaintext, fontsize=16];
/* the time-line graph */
past -> 1978 -> 1980 -> 1982 -> 1983 -> 1985 -> 1986 ->
1987 -> 1988 -> 1989 -> 1990 -> "future";
/* ancestor programs */
"Bourne sh"; "make"; "SCCS"; "yacc"; "cron"; "Reiser cpp";
"Cshell"; "emacs"; "build"; "vi"; "<curses>"; "RCS"; "C*";
}
{ rank = same;
"Software IS"; "Configuration Mgt"; "Architecture & Libraries";
"Process";
};
node [shape=box];
{ rank = same; "past"; "SCCS"; "make"; "Bourne sh"; "yacc"; "cron"; }
{ rank = same; 1978; "Reiser cpp"; "Cshell"; }
{ rank = same; 1980; "build"; "emacs"; "vi"; }
{ rank = same; 1982; "RCS"; "<curses>"; "IMX"; "SYNED"; }
{ rank = same; 1983; "ksh"; "IFS"; "TTU"; }
{ rank = same; 1985; "nmake"; "Peggy"; }
{ rank = same; 1986; "C*"; "ncpp"; "ksh-i"; "<curses-i>"; "PG2"; }
{ rank = same; 1987; "Ansi cpp"; "nmake 2.0"; "3D File System"; "fdelta";
"DAG"; "CSAS";}
{ rank = same; 1988; "CIA"; "SBCS"; "ksh-88"; "PEGASUS/PML"; "PAX";
"backtalk"; }
{ rank = same; 1989; "CIA++"; "APP"; "SHIP"; "DataShare"; "ryacc";
"Mosaic"; }
{ rank = same; 1990; "libft"; "CoShell"; "DIA"; "IFS-i"; "kyacc"; "sfio";
"yeast"; "ML-X"; "DOT"; }
{ rank = same; "future"; "Adv. Software Technology"; }
"PEGASUS/PML" -> "ML-X";
"SCCS" -> "nmake";
"SCCS" -> "3D File System";
"SCCS" -> "RCS";
"make" -> "nmake";
"make" -> "build";
.
.
.
}
Figure 11: Graph with constrained ranks
这定义了头部和尾部列之间的最小差异。例如,如果minlen=2,则头部和尾部之间始终至少 有一个中间等阶。请注意,这与两个节点之间的几何距离无关。
应谨慎进行微调。当在单个节点和边的布局没有过多"帮助"和干涉时,dot会更好地工作。 可以通过增加某些边的权重,或者使用style=invis创建不可见的边或节点,有时甚至通过 重新排列文件中节点和边的顺序来调整布局。但这可能会适得其反,因为相对于输入图中的 更改,布局不一定是稳定的。最后一次调整可能会使以前的所有更改无效,并生成非常糟糕 的图形。我们考虑的未来项目是将dot的数学布局技术与允许用户定义提示和约束的交互式 前端相结合。
This defines the minimum difference between the ranks of the head and tail. For example, if minlen=2, there will always be at least one intervening rank between the head and tail. Note that this is not concerned with the geometric distance between the two nodes.
Fine-tuning should be approached cautiously. dot works best when it can makes a layout without much "help" or interference in its placement of individual nodes and edges. Layouts can be adjusted somewhat by increasing the weight of certain edges, or by creating invisible edges or nodes using style=invis, and sometimes even by rearranging the order of nodes and edges in the file. But this can backfire because the layouts are not necessarily stable with respect to changes in the input graph. One last adjustment can invalidate all previous changes and make a very bad drawing. A future project we have in mind is to combine the mathematical layout techniques of dot with an interactive front-end that allows user-defined hints and constraints.
三、高级功能
节点端口
节点端口是边可以附着到节点的点。(当边未连接到端口时,它将对准节点的中心,并在 节点的边界处剪裁边。)
有两种类型的端口。可以为任何节点指定基于8个罗盘点"n"、"ne"、"e"、"se"、"s"、 "sw"、"w"或"nw"的端口。然后,边的末端将对准节点上的该位置。因此,若指定se端口, 则边缘将连接到其东南处的节点的"角落"。
此外,具有记录形状的节点可以使用记录结构来定义端口,而带有表的类似HTML的标签可以 使用元素的port属性将任何单元格设置为端口。如果记录框或表单元格定义了端口名,则 边缘可以使用该端口名来指示它应该对准框的中心。(默认情况下,边缘将剪裁到长方体的 边界。)
指定端口还有两种方法。一种方法是使用边缘的前端口和后端口属性,例如:
A node port is a point where edges can attach to a node. (When an edge is not attached to a port, it is aimed at the node’s center and the edge is clipped at the node’s boundary.)
There are two types of ports. Ports based on the 8 compass points "n", "ne", "e", "se", "s", "sw", "w" or "nw" can be specified for any node. The end of the edge will then be aimed at that position on the node. Thus, if se port is specified, the edge will connect to the node at its southeast "corner".
In addition, nodes with a record shape can use the record structure to define ports, while HTML-like labels with tables can make any cell a port using the PORT attribute of a <TD> element. If a record box or table cell defines a port name, an edge can use that port name to indicate that it should be aimed at the center of the box. (By default, the edge is clipped to the box’s boundary.)
There are also two ways to specify ports. One way is to use an edge’s headport and tailport attributes, e.g.
a -> b [tailport=se]或者,端口名可以用于修改节点名,作为边缘声明的一部分,使用语法"node name:port name"。因此,处理上述示例的另一种方法是:
Alternatively, the portname can be used to modify the node name as part of the edge declaration using the syntax node name:port name. Thus, another way to handle the example given above would be:
a -> b:se由于记录框有自己的角,可以在记录名称端口中添加指南针点端口。因此,边缘:
Since a record box has its own corners, one can add a compass point port to record name port. Thus, the edge:
a -> b:f0:se将附加到端口名为f0的记录节点b中方框的东南角。
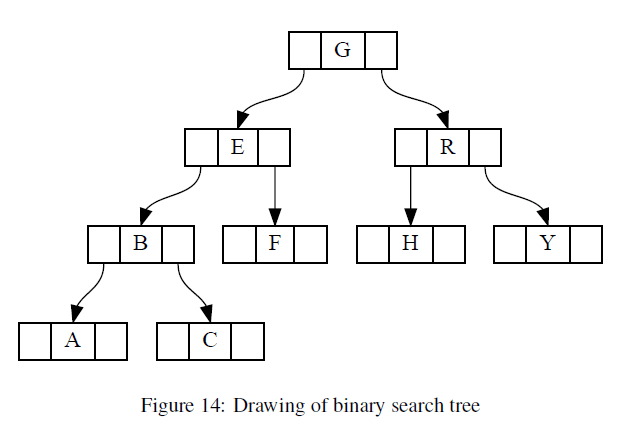
图13说明了记录节点中端口名称的声明和使用,结果如图14所示。
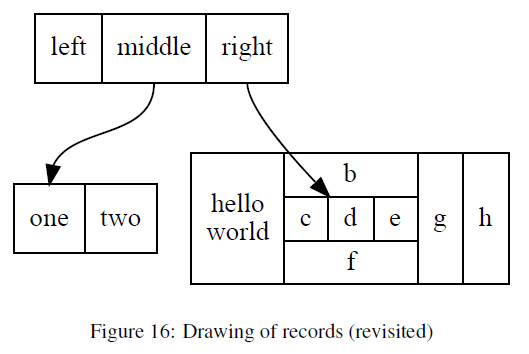
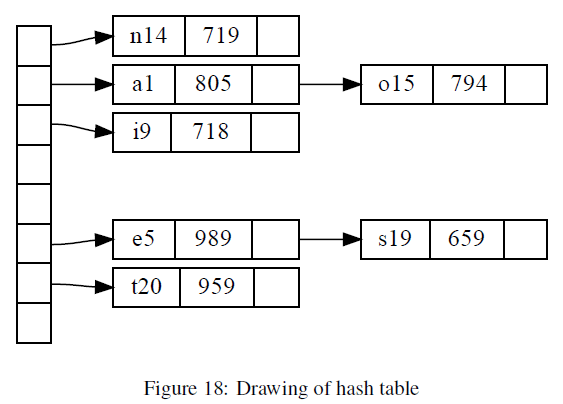
图15和16给出了使用记录节点和端口的另一个示例。这重复了图7和图8的示例,但现在使用 端口作为边的连接器。请注意,如果将记录的输入高度设置为一个较小的值,则记录的外观 有时会更好,因此文本标签控制实际大小,如图13所示。否则,假定默认节点大小为 0.75×0.5,如图16所示。图17和18的示例在哈希表的布局中使用从左到右的绘图。
will attach to the southeast corner of the box in record node b whose port name is f0.
Figure 13 illustrates the declaration and use of port names in record nodes, with the resulting drawing shown in Figure 14.
Figures 15 and 16 give another example of the use of record nodes and ports. This repeats the example of Figures 7 and 8 but now using ports as connectors for edges. Note that records sometimes look better if their input height is set to a small value, so the text labels dominate the actual size, as illustrated in Figure 13. Otherwise the default node size (.75 by .5) is assumed, as in Figure 16. The example of Figures 17 and 18 uses left-to-right drawing in a layout of a hash table.
簇(集群)
集群是一个子图,放置在布局的自己的不同矩形中。当子图的名称具有前缀cluster时, 子图被识别为一个簇。(如果顶级图的clusterrank=none,则关闭此特殊处理)标签、字体 特征和labelloc属性可以像顶级图形一样设置,尽管默认情况下集群标签显示在图形上方。 对于簇,默认情况下标签左对齐;如果labeljust="r",则标签右对齐。"color"属性指定 封闭矩形的颜色。此外,簇可能具有style="filled",在这种情况下,矩形在绘制簇之前 用fillcolor指定的颜色填充。(如果未指定fillcolor,则使用群集的颜色属性。)
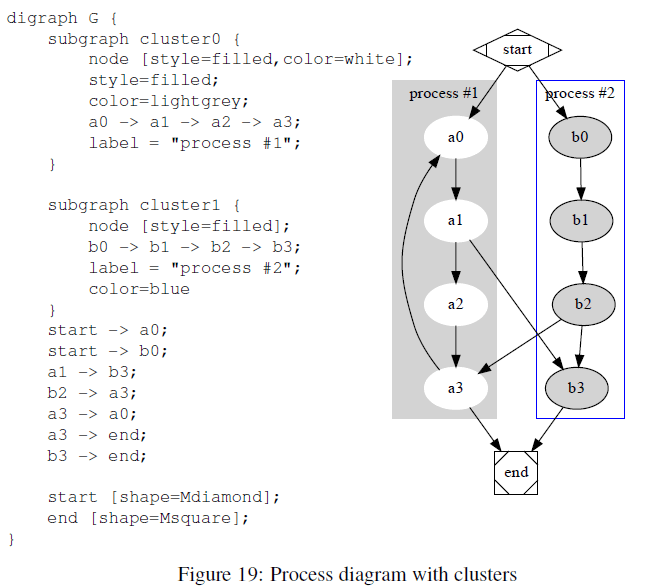
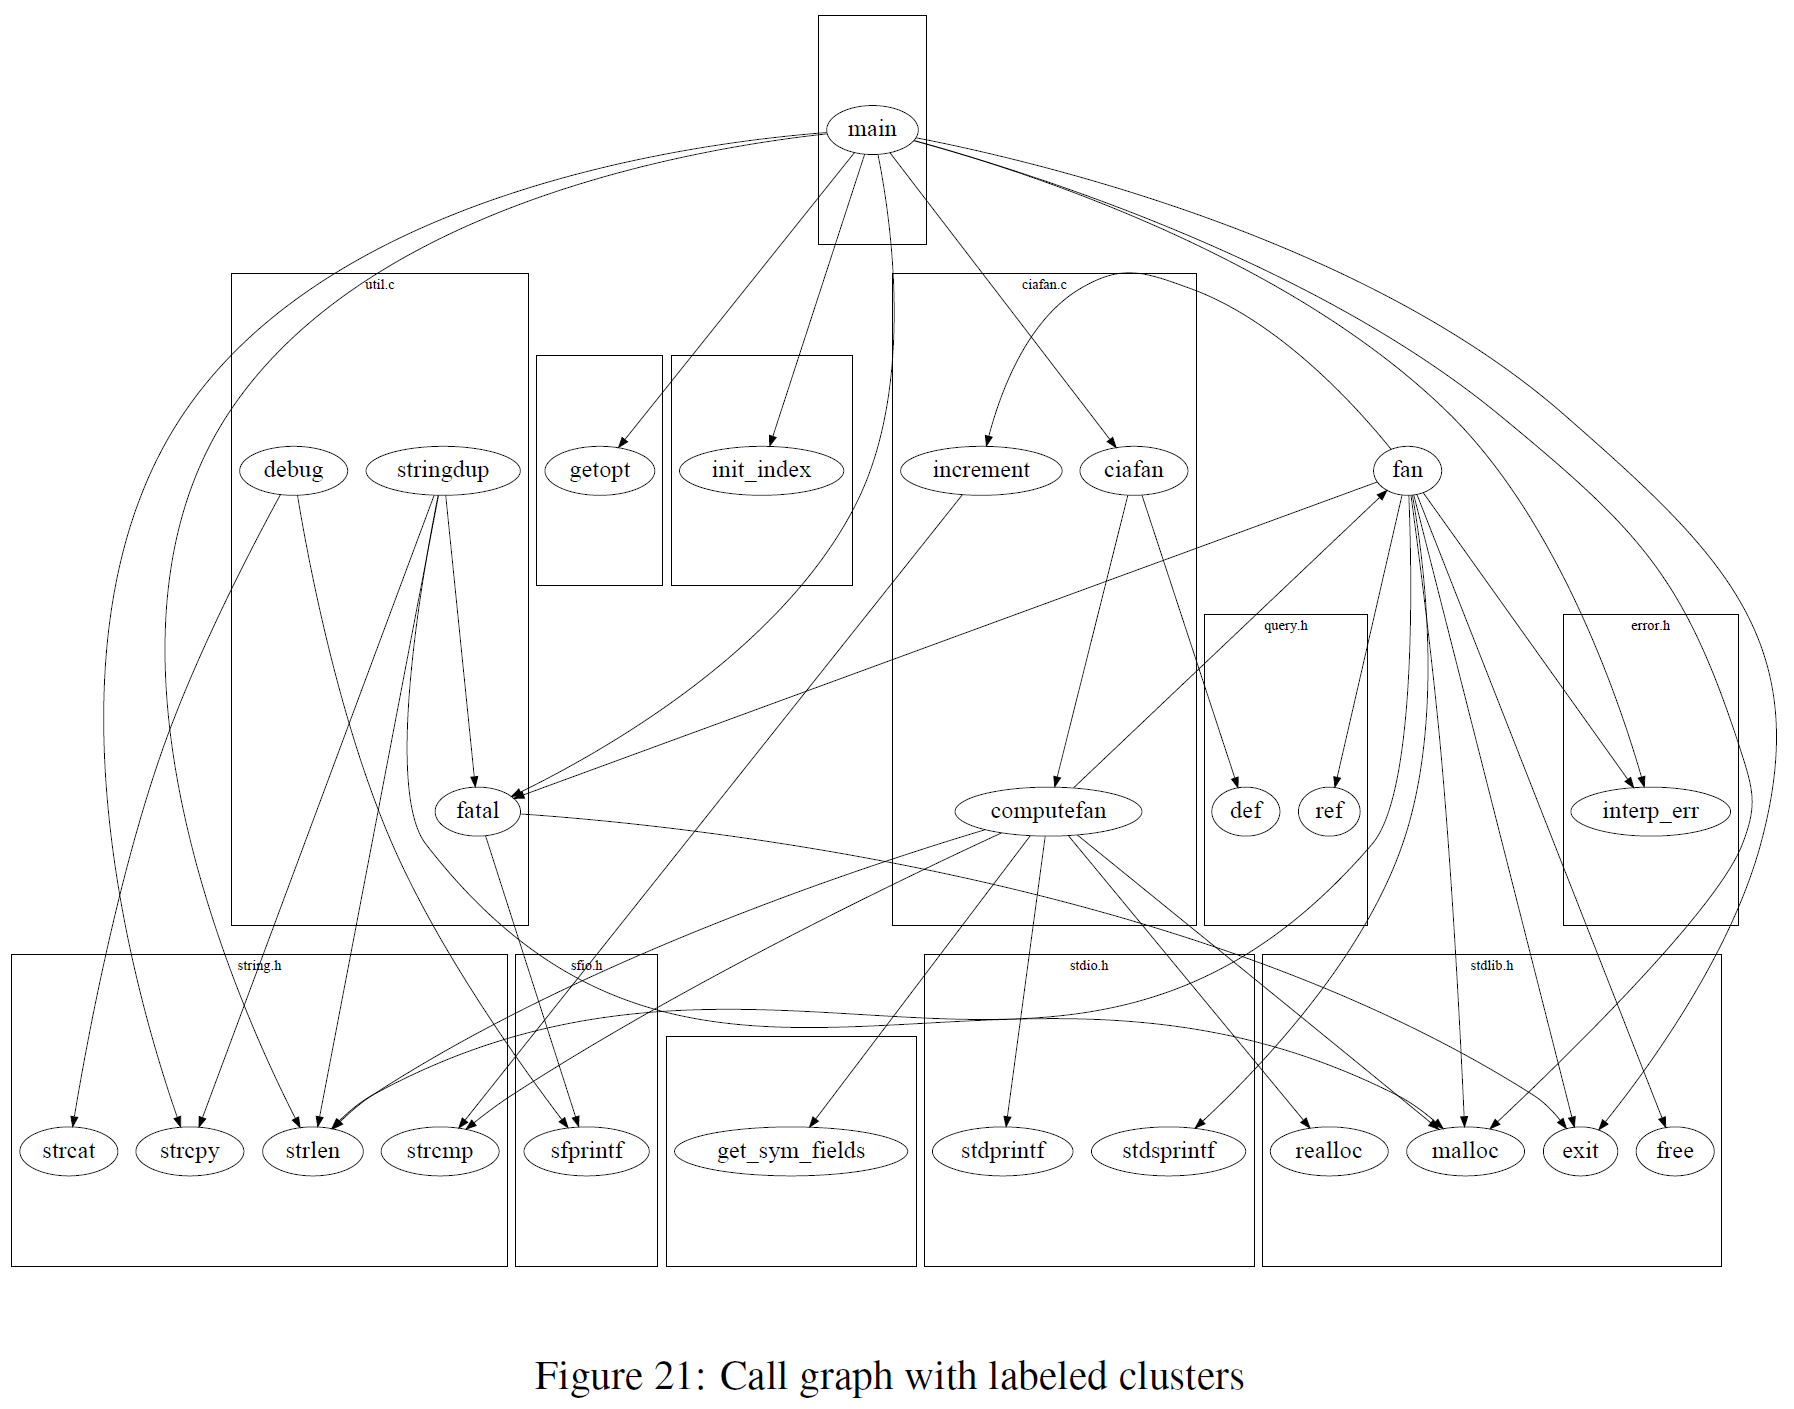
通过递归技术绘制簇,该技术计算簇内节点的等阶分配和内部排序。图19到21是集群布局 和相应的图形文件。
A cluster is a subgraph placed in its own distinct rectangle of the layout. A subgraph is recognized as a cluster when its name has the prefix cluster. (If the top-level graph has clusterrank=none, this special processing is turned off). Labels, font characteristics and the labelloc attribute can be set as they would be for the top-level graph, though cluster labels appear above the graph by default. For clusters, the label is left-justified by default; if labeljust="r", the label is right-justified. The color attribute specifies the color of the enclosing rectangle. In addition, clusters may have style="filled", in which case the rectangle is filled with the color specified by fillcolor before the cluster is drawn. (If fillcolor is not specified, the cluster’s color attribute is used.)
Clusters are drawn by a recursive technique that computes a rank assignment and internal ordering of nodes within clusters. Figure 19 through 21 are cluster layouts and the corresponding graph files.
1: digraph g {
2: node [shape = record,height=.1];
3: node0[label = "<f0> |<f1> G|<f2> "];
4: node1[label = "<f0> |<f1> E|<f2> "];
5: node2[label = "<f0> |<f1> B|<f2> "];
6: node3[label = "<f0> |<f1> F|<f2> "];
7: node4[label = "<f0> |<f1> R|<f2> "];
8: node5[label = "<f0> |<f1> H|<f2> "];
9: node6[label = "<f0> |<f1> Y|<f2> "];
10: node7[label = "<f0> |<f1> A|<f2> "];
11: node8[label = "<f0> |<f1> C|<f2> "];
12: "node0":f2 -> "node4":f1;
13: "node0":f0 -> "node1":f1;
14: "node1":f0 -> "node2":f1;
15: "node1":f2 -> "node3":f1;
16: "node2":f2 -> "node8":f1;
17: "node2":f0 -> "node7":f1;
18: "node4":f2 -> "node6":f1;
19: "node4":f0 -> "node5":f1;
20: }
Figure 13: Binary search tree using records
1: digraph structs {
2: node [shape=record];
3: struct1 [shape=record,label="<f0> left|<f1> middle|<f2> right"];
4: struct2 [shape=record,label="<f0> one|<f1> two"];
5: struct3 [shape=record,label="hello\nworld |{ b |{c|<here> d|e}| f}| g | h"];
6: struct1:f1 -> struct2:f0;
7: struct1:f2 -> struct3:here;
8: }
Figure 15: Records with nested fields (revisited)
1: digraph G {
2: nodesep=.05;
3: rankdir=LR;
4: node [shape=record,width=.1,height=.1];
5:
6: node0 [label = "<f0> |<f1> |<f2> |<f3> |<f4> |<f5> |<f6> | ",height=2.5];
7: node [width = 1.5];
8: node1 [label = "{<n> n14 | 719 |<p> }"];
9: node2 [label = "{<n> a1 | 805 |<p> }"];
10: node3 [label = "{<n> i9 | 718 |<p> }"];
11: node4 [label = "{<n> e5 | 989 |<p> }"];
12: node5 [label = "{<n> t20 | 959 |<p> }"] ;
13: node6 [label = "{<n> o15 | 794 |<p> }"] ;
14: node7 [label = "{<n> s19 | 659 |<p> }"] ;
15:
16: node0:f0 -> node1:n;
17: node0:f1 -> node2:n;
18: node0:f2 -> node3:n;
19: node0:f5 -> node4:n;
20: node0:f6 -> node5:n;
21: node2:p -> node6:n;
22: node4:p -> node7:n;
23: }
Figure 17: Hash table graph file
digraph G {
subgraph cluster0 {
node [style=filled,color=white];
style=filled;
color=lightgrey;
a0 -> a1 -> a2 -> a3;
label = "process #1";
}
subgraph cluster1 {
node [style=filled];
b0 -> b1 -> b2 -> b3;
label = "process #2";
color=blue
}
start -> a0;
start -> b0;
a1 -> b3;
b2 -> a3;
a3 -> a0;
a3 -> end;
b3 -> end;
start [shape=Mdiamond];
end [shape=Msquare];
}
Figure 19: Process diagram with clusters
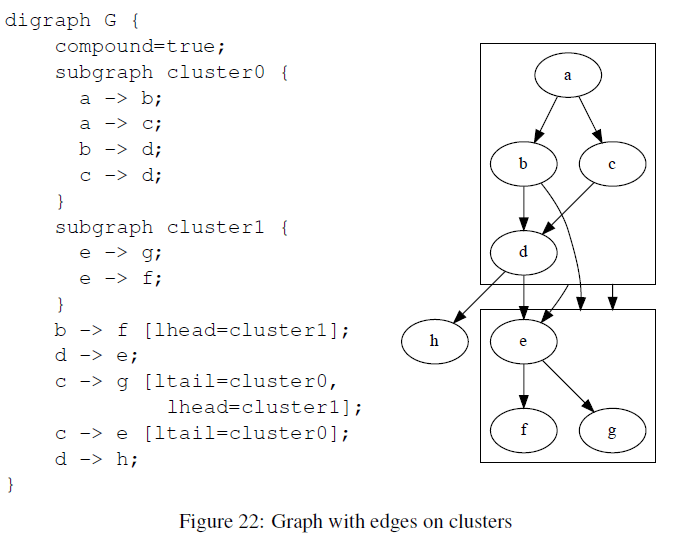
如果顶级图的"复合"属性设置为true,则点将允许边连接节点和簇。这是通过定义lhead 或ltail属性的边来实现的。这些属性的值必须分别是包含头节点或尾节点的集群的名称。 在这种情况下,将在簇边界处剪裁边。所有其他边属性(如箭头或方向)都将应用于 截断边。例如,图22显示了一个使用复合属性的图形和结果图。
If the top-level graph has the compound attribute set to true, dot will allow edges connecting nodes and clusters. This is accomplished by an edge defining an lhead or ltail attribute. The value of these attributes must be the name of a cluster containing the head or tail node, respectively. In this case, the edge is clipped at the cluster boundary. All other edge attributes, such as arrowhead or dir, are applied to the truncated edge. For example, Figure 22 shows a graph using the compound attribute and the resulting diagram.
集中器
在顶层图形上设置concent=true可以使用边合并技术来减少密集布局中的混乱。当边在平行 运行、具有公共端点且长度大于1时,将合并边。在固定大小的布局中,一个有益的副作用 是,去除这些边缘通常可以获得更大、更可读的标签。虽然dot中的集中器看起来有点像 Newbery的[New89],但它们是通过搜索布局中的边来找到的,而不是通过检测底层图中的 完整两部图来找到的。因此,dot的方法运行更快,但不会像Newbery算法那样折叠很多边。
Setting concentrate=true on the top-level graph enables an edge merging technique to reduce clutter in dense layouts. Edges are merged when they run parallel, have a common endpoint and have length greater than 1. A beneficial side-effect in fixed-sized layouts is that removal of these edges often permits larger, more readable labels. While concentrators in dot look somewhat like Newbery’s [New89], they are found by searching the edges in the layout, not by detecting complete bipartite graphs in the underlying graph. Thus the dot approach runs much faster but doesn’t collapse as many edges as Newbery’s algorithm.
四、命令行选项
默认情况下,dot以过滤器模式运行,从stdin读取图形,然后以添加布局属性的dot格式 将图形写入stdout。dot支持多种命令行选项:
By default, dot operates in filter mode, reading a graph from stdin, and writing the graph on stdout in the DOT format with layout attributes appended. dot supports a variety of commandline options:
-T format设置输出的格式。允许的格式值为:
- bmp:Windows位图格式。
- canon:漂亮打印输入;没有完成布局。
- dot:属性DOT。打印带有作为属性附加的布局信息的输入,参见附录F。
- fig:图输出。
- gd:GD格式。这是GD图形库使用的内部格式。另一种格式是gd2。
- gif:GIF输出。
- imap:为服务器端图像地图生成地图文件。这可以与输出的图形形式相结合,例如,
在网页中使用
-T gif或-T jpg将链接附加到节点和边。 - cmapx:为客户端图像地图生成HTML地图文件。
- pdf:通过开罗图书馆的Adobe
PDF。我们在嵌入其他文档时遇到了问题。相反,请
使用
-T ps2,如下所述。 - plain:简单的基于行的ASCII格式。附录E描述了这个输出。另一种格式是plain-ext, 它在边的头尾节点上提供端口名称。
- png:PNG(便携式网络图形)输出。
- ps:PostScript(EPSF)输出。
- ps2:带有PDF注释的PostScript(EPSF)输出。在包含在文档中之前,应将此输出提取 为PDF,例如pdflatex。(使用ps2pdf;epstopdf不处理%%BoundingBox: (atend)。)
- svg:SVG输出。替代形式svgz生成压缩的SVG。
- vrml:VRML输出。
- wbmp:无线位图(WBMP)格式。
1:digraph G {
2: size="8,6"; ratio=fill; node[fontsize=24];
3:
4: ciafan->computefan; fan->increment; computefan->fan; stringdup->fatal;
5: main->exit; main->interp_err; main->ciafan; main->fatal; main->malloc;
6: main->strcpy; main->getopt; main->init_index; main->strlen; fan->fatal;
7: fan->ref; fan->interp_err; ciafan->def; fan->free; computefan->stdprintf;
8: computefan->get_sym_fields; fan->exit; fan->malloc; increment->strcmp;
9: computefan->malloc; fan->stdsprintf; fan->strlen; computefan->strcmp;
10: computefan->realloc; computefan->strlen; debug->sfprintf; debug->strcat;
11: stringdup->malloc; fatal->sfprintf; stringdup->strcpy; stringdup->strlen;
12: fatal->exit;
13:
14: subgraph "cluster_error.h" { label="error.h"; interp_err; }
15:
16: subgraph "cluster_sfio.h" { label="sfio.h"; sfprintf; }
17:
18: subgraph "cluster_ciafan.c" { label="ciafan.c"; ciafan; computefan;
19: increment; }
20:
21: subgraph "cluster_util.c" { label="util.c"; stringdup; fatal; debug; }
22:
23: subgraph "cluster_query.h" { label="query.h"; ref; def; }
24:
25: subgraph "cluster_field.h" { get_sym_fields; }
26:
27: subgraph "cluster_stdio.h" { label="stdio.h"; stdprintf; stdsprintf; }
28:
29: subgraph "cluster_<libc.a>" { getopt; }
30:
31: subgraph "cluster_stdlib.h" { label="stdlib.h"; exit; malloc; free; realloc; }
32:
33: subgraph "cluster_main.c" { main; }
34:
35: subgraph "cluster_index.h" { init_index; }
36:
37: subgraph "cluster_string.h" { label="string.h"; strcpy; strlen; strcmp; strcat; }
38:}
Figure 20: Call graph file
digraph G {
compound=true;
subgraph cluster0 {
a -> b;
a -> c;
b -> d;
c -> d;
}
subgraph cluster1 {
e -> g;
e -> f;
}
b -> f [lhead=cluster1];
d -> e;
c -> g [ltail=cluster0,
lhead=cluster1];
c -> e [ltail=cluster0];
d -> h;
}
Figure 22: Graph with edges on clusters
-G name=value 设置图形属性默认值。
通常,在命令行而不是图形文件中设置大小、分页和相关值更方便。类似的标志-N或-E
设置默认节点或边缘属性。请注意,文件内容会覆盖命令行参数。
-l libfile 指定设备相关的图形库文件。
可以给出多个库。这些名称在输出开始时 传递给代码生成器。
-o outfile 将输出写入文件outfile。
-v 请求详细输出。
在处理大型布局时,详细的消息可供对dot的进度进行一些估计。
-V 打印版本号并退出。
五、混杂的
在顶级图标题中,可以将图声明为严格有向图或严格无向图。这禁止创建多条边,即在有向 情况下,最多可以有一条边具有给定的尾部节点和头部节点。对于无向图,最多可以有一条 边连接到相同的两个节点。使用相同两个节点的后续边缘语句将使用先前定义的边缘来 识别边缘,并应用边缘语句中给定的任何属性。
In the top-level graph heading, a graph may be declared a strict digraph or a strict graph. This forbids the creation of multi-edges, i.e., there can be at most one edge with a given tail node and head node in the directed case. For undirected graphs, there can be at most one edge connected to the same two nodes. Subsequent edge statements using the same two nodes will identify the edge with the previously defined one and apply any attributes given in the edge statement.
节点、边和图可能具有URL属性。在某些输出格式(ps2、imap、cmapx或svg)中,此信息 集成在输出中,以便节点、边和簇在使用适当的工具显示时成为活动链接。通常,附加到 顶级图的URL用作基本URL,支持组件上的相对URL。当输出格式为imap或cmapx时,将对 headURL和tailURL属性进行类似的处理。
对于某些格式(ps、fig或svg),注释属性可用于在输出中嵌入人类可读的符号。
Nodes, edges and graphs may have a URL attribute. In certain output formats (ps2, imap, cmapx, or svg), this information is integrated in the output so that nodes, edges and clusters become active links when displayed with the appropriate tools. Typically, URLs attached to top-level graphs serve as base URLs, supporting relative URLs on components. When the output format is imap, or cmapx, a similar processing takes place with the headURL and tailURL attributes.
For certain formats (ps, fig or svg), comment attributes can be used to embed human-readable notations in the output.
六、结论
dot生成令人愉悦的层次图形,可应用于多种设置由于dot的基本算法运行良好,我们为 进一步研究大型图形绘制方法和在线(动画)图形绘制等问题奠定了良好的基础。
dot produces pleasing hierarchical drawings and can be applied in many settings. Since the basic algorithms of dot work well, we have a good basis for further research into problems such as methods for drawing large graphs and online (animated) graph drawing.
七、致谢
我们感谢Phong Vo对图形绘制算法和编程的建议。图形库使用Phong的splay树字典库。 另外,dot的前身dag的用户也给了我们很多很好的建议。Guy Jacobson和Randy Hackbarth 审查了本手册的早期草稿,Emden对当前的修订做出了重大贡献。John Ellson编写了广义 多边形形状,并付出了相当大的努力使其健壮和高效。他还编写了GIF和ISMAP生成器以及 其他将Graphviz引入网络的工具。
We thank Phong Vo for his advice about graph drawing algorithms and programming. The graph library uses Phong’s splay tree dictionary library. Also, the users of dag, the predecessor of dot, gave us many good suggestions. Guy Jacobson and Randy Hackbarth reviewed earlier drafts of this manual, and Emden contributed substantially to the current revision. John Ellson wrote the generalized polygon shape and spent considerable effort to make it robust and efficient. He also wrote the GIF and ISMAP generators and other tools to bring Graphviz to the web.